Open Source Projects
A couple of open-source I’ve been working on:
JAX-Tqdm
github.com/jeremiecoullon/jax-tqdm
This library allows you to add the popular Python tqdm progress bar to JAX compiled scans and loops. The original method was developed by Jeremie Coullon, and this repo packages it up, and it can be installed from pip
pip install jax-tqdm
Its usage is as simple as annotating JAX scans or loops, e.g.
from jax_tqdm import scan_tqdm
from jax import lax
import jax.numpy as jnp

n = 10_000

@scan_tqdm(n)
def step(carry, x):
    return carry + 1, carry + 1

last_number, all_numbers = lax.scan(step, 0, jnp.arange(n))
see the README for more details.
Jaxpr-Viz
github.com/zombie-einstein/jaxpr-viz
This library is designed to visualise JAX computation graphs. JAX has built-in methods to visualise the HLO graph produced by JAX, but when I’ve used this, I’ve found it somewhat too low-level and hard to parse.
The intention of Jaxpr-viz it to generate higher-level representations of the
computation graph with more information about the structure of the program,
i.e. how jax.jit annotated sub-function are connected. It does this
by parsing the jaxpr generated
by JAX when it parses the Python input.
So for example a JAX program with nested functions
@jax.jit
def foo(x):
    return 2 * x

@jax.jit
def bar(x):
    x = foo(x)
    return x - 1
when visualised by Jaxpr-viz produces:
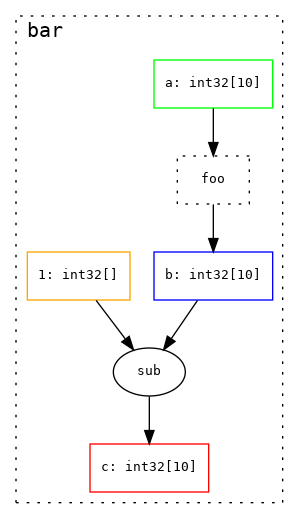
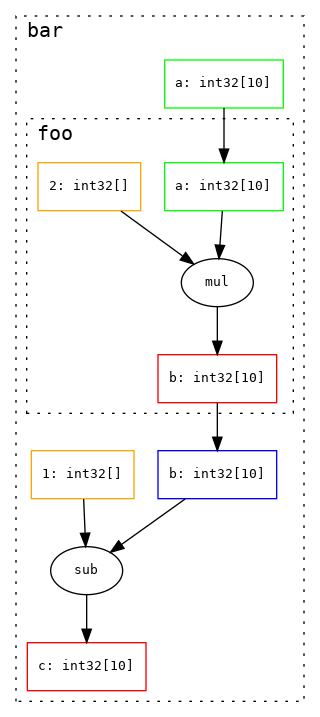
By default, it will collapse sub-graphs that only contain built in primitives, to make the structure of the overall program clearer. This can be toggled to show the full details of the computation graph:
It can also visualise more complex primitives like conditional statements
@jax.jit
def conditional(arg):
    return jax.lax.cond(
        arg >= 0.0,
        lambda x_true: x_true + 3.0,
        lambda x_false: x_false - 3.0,
        arg
    )
producing
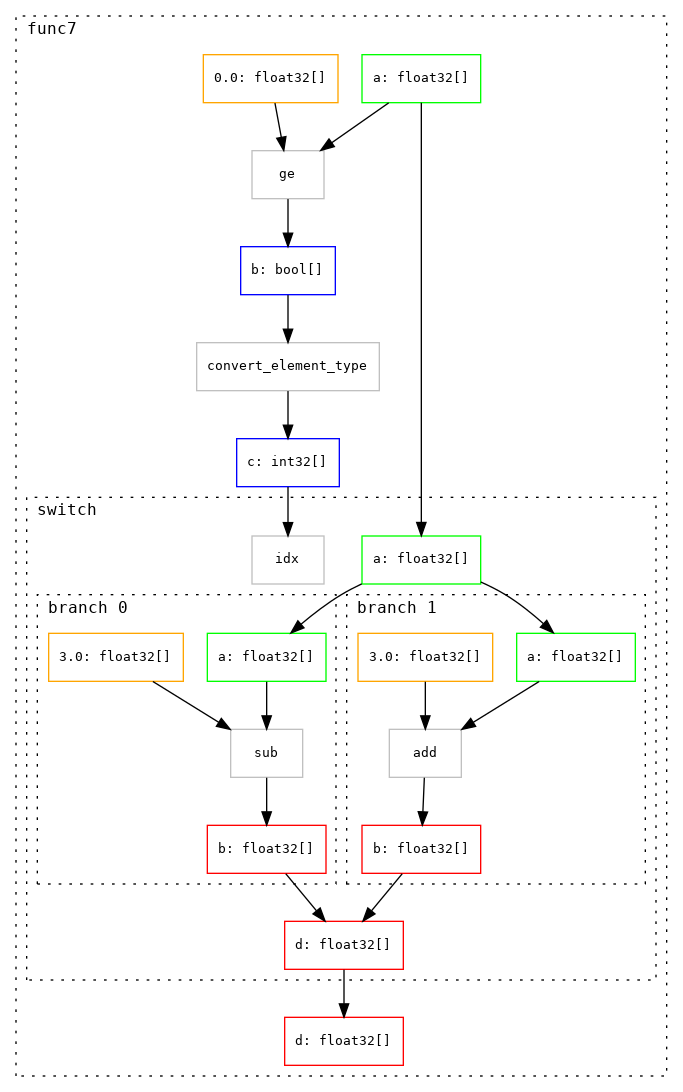
Switch statements and scans/loops are also supported.
See the repo for more details and installation instructions.
At the moment it used pydot/graphviz in the backend to produce static renders of the computation graph. In future, it might be nice to have a more interactive visualisation, for example to allow regions of the graph to be dynamically collapsed and expanded.